|
For several years the diamond industry has designed most of its new diamond cuts using various computer aided design software like GemCad. The virtual models of potential new diamond cuts are then transferred into DiamCalc software. Designers check the appearance and light performance with DiamCalc photo-realistic images and "virtual" cut assessment tools like Hearts and Arrows viewers, ASET and Ideal-Scope. By trial and error designers then optimize the proportions. OctoNus's new DiamCalc 3.0 vastly improves this process.
Important news in this newsletter:
- The new features in DiamCalc3.0
- High Dynamic Range movies and images created with High Dynamic Range panoramas and real observers
- ETAS images
- Cut Designer builds variable models
- The new features in DiamCalc3.0Pro
(Beta professional version)
- Create optimization charts from various cut performance data for a range of cut proportions
- ETAS data outputs for any selected proportion variations
- Automatically generate images for all proportion variations
- Automatically generate individual .gem files for all proportion variations
- Forums and Tutorials on www.OctoNus.com
1. The new features in DiamCalc3.0
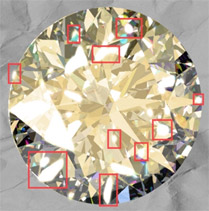 No photograph can show the sparkle and brightness of a real diamond. Until now; DiamCalc3.0 (DC3) has High Dynamic Range (HDR) imaging that shows the intense sparkles on your computer screen by reproducing the flares or bloom that we see in real diamonds. Bright sparkles often appear to be larger than the facet they emanate from, even extending outside the edge of the diamond (as shown in the virtual diamond photo on the left). Please see the examples of Demo Movies No photograph can show the sparkle and brightness of a real diamond. Until now; DiamCalc3.0 (DC3) has High Dynamic Range (HDR) imaging that shows the intense sparkles on your computer screen by reproducing the flares or bloom that we see in real diamonds. Bright sparkles often appear to be larger than the facet they emanate from, even extending outside the edge of the diamond (as shown in the virtual diamond photo on the left). Please see the examples of Demo Movies
Scintillation is the last great frontier of diamond cut studies. Regular ray tracing software and lab grading systems have failed to model scintillation and capture this 'bloom' factor. Now buyers and sellers can realistically show a client, or visualize a distant diamond themselves before buying it. They can see just how it will look as they rock it from side to side in their own environment and even make promotional videos for individual diamonds.
DiamCalc's High Dynamic Range lighting can come from a variety of panoramas such as a ball room, forest or hillside so anyone can see how the diamond will look in each of these environments. Special high dynamic range 360? panoramic images like the one on the left can be uploaded into DiamCalc3, along with a photograph of a real observer on right. The diamond, the observer or the panorama can each be moved independently.

Jewelers of the future will no doubt import panoramic images of their own sales floor into DiamCalc
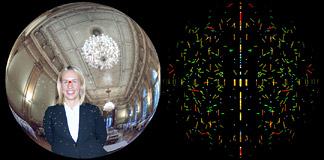 Additional features in standard and professional versions of DiamCalc include ETAS images (effective total angular size) which at a glance give a good indication of where a diamond can gather light that creates brightness and sparkle. The image on the left shows an ETAS images from the diamonds perspective overlain on the HDR image of the observer placed inside a ballroom. The image on the right is a DETAS image for an emerald cut that shows the dynamic probability to see a sparkle as the diamond is rocked through a small range of north south motion. Additional features in standard and professional versions of DiamCalc include ETAS images (effective total angular size) which at a glance give a good indication of where a diamond can gather light that creates brightness and sparkle. The image on the left shows an ETAS images from the diamonds perspective overlain on the HDR image of the observer placed inside a ballroom. The image on the right is a DETAS image for an emerald cut that shows the dynamic probability to see a sparkle as the diamond is rocked through a small range of north south motion.
 ETAS is the basic functional tool for the quantification of the basic light performance responses calculated by DiamCalc3. But DiamCalc3 takes this a further stage by computing for two eyes and other observer specific variables such as pupil size and viewing distance. Dynamic ETAS (DETAS) is a metric for quantification of scintillation.
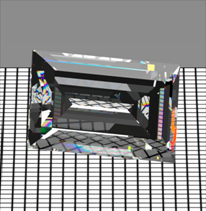
The result of new technologies is the highly photorealistic images reflecting both non-trivial optical properties of gemstones and compound features of environment as shown here where the diamond is positioned above a virtual sheet of paper with a grid pattern. ETAS is the basic functional tool for the quantification of the basic light performance responses calculated by DiamCalc3. But DiamCalc3 takes this a further stage by computing for two eyes and other observer specific variables such as pupil size and viewing distance. Dynamic ETAS (DETAS) is a metric for quantification of scintillation.
The result of new technologies is the highly photorealistic images reflecting both non-trivial optical properties of gemstones and compound features of environment as shown here where the diamond is positioned above a virtual sheet of paper with a grid pattern.
For companies active in designing special cuts such as many Sightholders, Tiffany and Swarovski, the new cut designer tool enables the creation of parametric models with tied proportions; each and parameters can be varied. This overcomes a problem in previous computer aided design software that required the laborious creation of separate models for every new proportion set.
2. New features in DiamCalc3.0 Pro
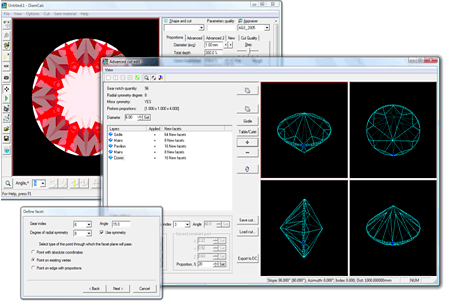
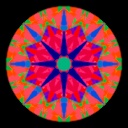
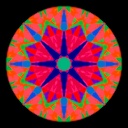
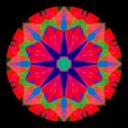
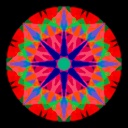
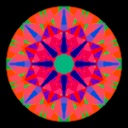
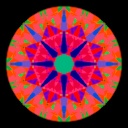
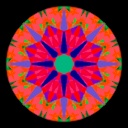
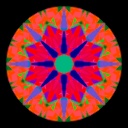
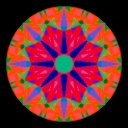
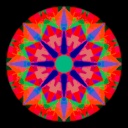
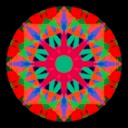
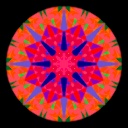
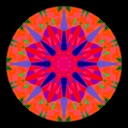
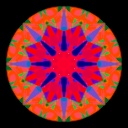
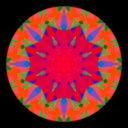
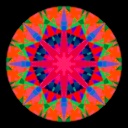
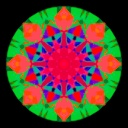
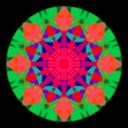
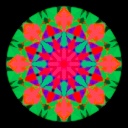
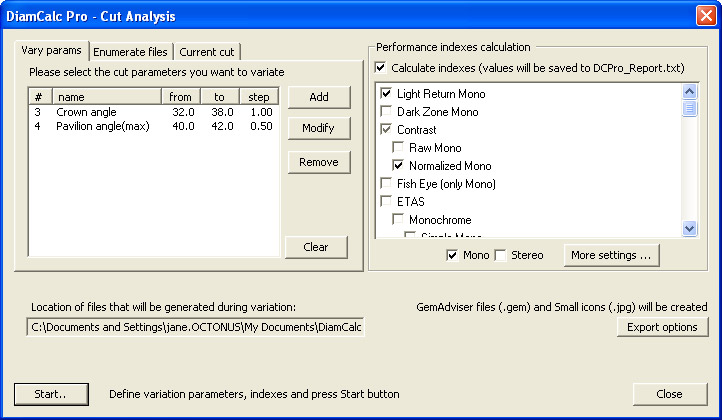
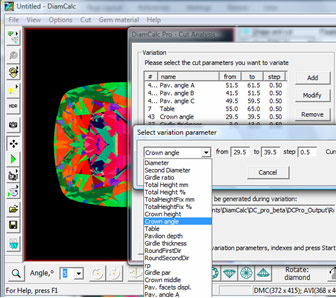 The advanced professional version, DC3.0Pro, takes tied proportion models a step further by automatically generating models with variations of chosen proportions as shown in the selection box on the left. The software can then generate charts of model images in any lighting format (e.g. AGS ASET images) for thousands of nominated proportion combinations. These charts of virtual images can be used to avoid ugly dark zones like fish-eye and nail-head effects. The advanced professional version, DC3.0Pro, takes tied proportion models a step further by automatically generating models with variations of chosen proportions as shown in the selection box on the left. The software can then generate charts of model images in any lighting format (e.g. AGS ASET images) for thousands of nominated proportion combinations. These charts of virtual images can be used to avoid ugly dark zones like fish-eye and nail-head effects.
The same operation enables generation of data for any selection from more than 10 basic light performance responses (as shown on the right below). The output data can then be converted to performance graphs and charts (see the example on the next page) for the optimization of the cut being studied to identify the best proportion combinations to achieve maximum brilliance fire and scintillation and good yield for of any diamond.
DiamCalc's exciting new features for the design of new cuts and optimization of proportions will undoubtedly lead to the development of better new cuts. OctoNus envisages that creative designers will develop diamonds as good as, or even better, than the traditional round brilliant. Labs too will find this tool useful in developing cut grading applications which for the first time will enable grading any cut, new or existing, and the grades can be on the same comparative scale. That means that consumers, retailers, dealers and cut designers will be able to compare diamonds of different cuts using independent and repeatable light response information and tools.
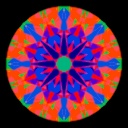
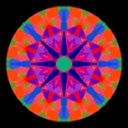
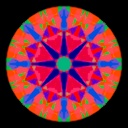
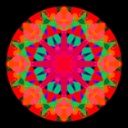
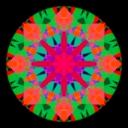
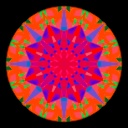
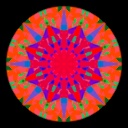
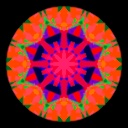
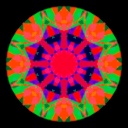
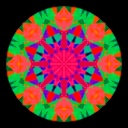
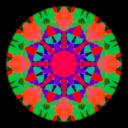
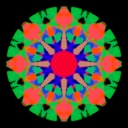
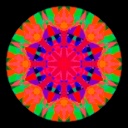
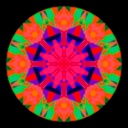
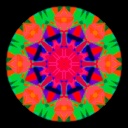
Example 1. Html chart produced automatically by selecting variables: Crown angle and Pavilion angle with ASET special view
| Pavilion angle(max) \ Crown angle |
32.0 |
33.0 |
34.0 |
35.0 |
36.0 |
37.0 |
38.0 |
| 40.0 |
 |
 |
 |
 |
 |
 |
 |
| 40.5 |
 |
 |
 |
 |
 |
 |
 |
| 41.0 |
 |
 |
 |
 |
 |
 |
 |
| 41.5 |
 |
 |
 |
 |
 |
 |
 |
| 42.0 |
 |
 |
 |
 |
 |
 |
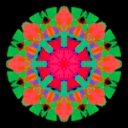 |
By clicking on any image a Gem Adviser or DiamCalc 3D model of that stone will open.
Once the 3D model is opened you can:
- Evaluate Light Return, Leakage and a couple of other diamond characteristics
- See a photorealistic diamond picture with different lighting
- Record and play a movie with diamond
tilting in different directions by using button Play
- Change the lighting models: Office and Disco
Example 2. Html chart produced automatically by selecting variables: Crown angle and Pavilion angle with H&A special view
| Pavilion angle(max) \ Crown angle |
32.0 |
33.0 |
34.0 |
35.0 |
36.0 |
37.0 |
38.0 |
| 40.0 |
 |
 |
 |
 |
 |
 |
 |
| 40.5 |
 |
 |
 |
 |
 |
 |
 |
| 41.0 |
 |
 |
 |
 |
 |
 |
 |
| 41.5 |
 |
 |
 |
 |
 |
 |
 |
| 42.0 |
 |
 |
 |
 |
 |
 |
 |
By the DiamCalc Pro any type of image can be generated, for any cut and any proportion variable.
OctoNus will establish a forum and tutorials on its website to enable users to keep up to date with these new advances. We invite you and all DiamCalc users to participate in this forum.
3. Forums and Tutorials
Over the coming months www.octonus.com will launch help group Forums and Video Tutorials to answer FAQ's. We invite you to participate.
The OctoNus DiamCalc team wishes you great productivity from the new tools added to DiamCalc. We also welcome feedback and suggestions for improvements. Please send message to OctoNus |


